Drupal Migrations (V): Debugging Migrations-II

Following the previous post, in this article I wanted to share again some guidelines for debugging Drupal Migrations. While in the last article I wrote down some questions about modules, plugins and configuration object management, in this case I felt like stopping at something more “code-oriented”, more specific. I have chosen for this article some guidelines to configure Xdebug in an IDE (in this case I have used PHPStorm) for migrations running in a locally deployed Drupal using DDEV. With the aim of debugging a Migration process -although actually the process is similar for any other development, since it is something certainly transversal-, here I share with you my fifth article about migrations at Drupal. I hope you find it useful.
Picture from Unsplash, user Neenu Vimalkumar, @dreamquest12610
Table of Contents
1- Introduction to Xdebug
2- Xdebug for DDEV
3- Steps for seeting up the IDE
4- Errors launching Drush in containers
5- :wq!
This article is part of a series of posts about Drupal Migrations:
1- Drupal Migrations (I): Basic Resources
- Core Modules for Migrations in Drupal.
- Contributed Modules for Migrations in Drupal.
- Contributed Modules for Plugins in Migrations.
- Contributed Modules Drush - Related.
- Authors you should now.
2- Drupal Migrations (II): Examples
- Introduction: Migration as code or as configuration.
- Arrangements: Migrating embedded data and CSV file.
- Approaches for the Migrations.
- Executing Migrations.
- Key Concepts for the Migrations.
- Resources for the Migrations.
3- Drupal Migrations (III): Migrating from Google Spreadsheet
- Remember ETL processes.
- Exposing Data Through Google Spreadsheet.
- Special Properties from the JSON transformation.
- Characteristics of the Migration.
- Custom Module for Migration.
4- Drupal Migrations (IV): Debugging Migrations First Part
- Basic Debugging of a Drupal Migration: files, database tables and configuration objects.
- Average Debugging with Migrate Devel Module.
5- Drupal Migrations (V): Debugging Migrations-II
- Introduction to Xdebug.
- Xdebug for DDEV.
- Steps for setting up the IDE.
- Errors launching Drush in containers.
1- Introduction to Xdebug
In this section we’re going to share some debugging tactics for our migrations that can complement the actions discussed in the previous article: we already know how to check the configuration files, how to use certain processing plugins to extract information from the process and at this moment we’re going to add the third piece to the construction: how to debug the operation of a migration from the point of view of the related code, that is, through the PHP classes involved in all the mechanics.
Xdebug is a classic PHP extension that in its simplest dimension, allows us to track variables from the code to see their values through the execution flows of your software. In this post we won’t stop to explain how to install, configure and manage Xdebug in general terms, but we can be interested in a particular case: in order to run your local Drupal installations and test your migrations, you can use DDEV, a tool for creating local development environments based on Docker containers that already has a pre-installation of Xdebug ready to use.
DDEV avoids having to implement classic LAMP environments by compartmentalizing networks of Docker containers already pre-configured with all the development tools already included, including Xdebug. Here you can find more information, articles and resources about the tool:
https://github.com/drud/awesome-ddev.
2- Xdebug for DDEV
Accepting the premise that we are in a environment build with DDEV, the activation of Xdebug can easily be done in two ways:
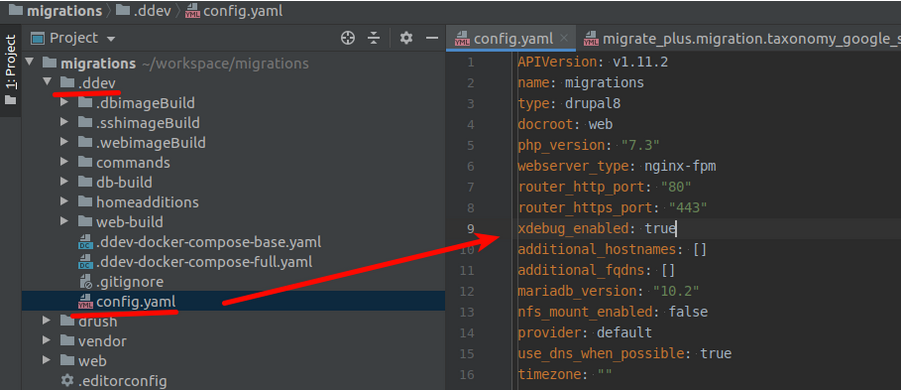
Either by editing the config.yaml file in the .ddev resource folder, path: your_project/.ddev/config.yaml, where you can activate xdebug on line 9 of the file:
Or by command line, using the DDEV-related commands outside the container:
ddev exec enable_xdebug
ddev exec disable_xdebug
Or also:
ddev xdebug
ddev xdebug on
ddev xdebug off
The above commands will serve to activate and deactivate the resource (for performance reasons, the initial state of Xdebug in a DDEV installation is deactivated by default). Since Xdebug is a server-side tool, it is already in the container acting as a web server and requires no further configuration. It’s just a matter of preparing our usual IDE.
In essence, any IDE works the same way with Xdebug: it listens on a port and reacts as soon as it receives an input. Xdebug usually uses port 9000, and for each IDE there are some configuration examples that you can follow here:
- ddev.readthedocs.io/#step-debugging-with-ddev-and-xdebug .
- glamanate.com/xdebug-over-command-line-ddev.
And the basic technique was already exposed at the time by the PHPStorm team (Now I’m using PHPStorm for this example): https://blog.jetbrains.com/phpstorm/2012/03/new-in-4-0-easier-debugging-of-remote-php-command-line-scripts/.
3- Steps for setting up the IDE
Let’s look at some basic steps of setting up Xdebug in the PHPStorm IDE, although the philosophy behind it in others like VSCode is just the same.
The first idea is that by activating Xdebug, we’ll have it available for any PHP script running from the command line. This makes it especially valuable for debugging Drush or Drupal Console (Old and abandoned Drupal Console, BTW) . In this case, we also add the enormous facilitation of automated activation already in Xdebug in local DDEV-based deployments, so we add a lot of facilities to debug our migration.
Let’s take the next steps:
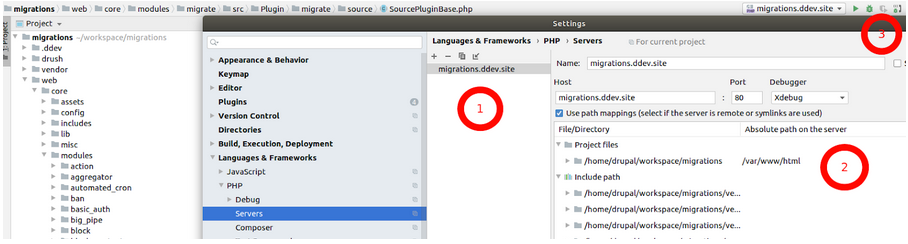
1- Server for the project
Open the Server configuration for your project: go to File-> Settings -> Languages & Frameworks -> PHP -> Servers and create a new Server in the side menu. Give it a name (it will be easier if you use the name of your DDEV deployment for the project). Add port 80 and activate Xdebug as debugger.
2- Initial setup
When using PHPStorm non-locally, we need to set up an “external” server and map the project files. In the case of not being in a classic LAMP environment (that would be local environment), we will need to make this configuration (Docker or DDEV suppose a non-local way of deployment in some way). DDEV serves the Drupal installation files from within its web container, starting with /var/www/html/ but the files are located locally within a typical /home/user/folder/projects/my_project path, so we will load this file mapping.
3- Listening Debug connections
Activate the active listening button for debugging.
4- Load environment variable in the container
For this we have two options. We can either load it for each debugging session, entering it into the DDEV container using the ddev ssh instruction and then loading the environment variable from inside the web container with the next instruction, just execute:export PHP_IDE_CONFIG="serverName=your.project.name.ddev.site"
You can also permanently load the environment variable by creating a companion file in the .ddev/ folder of the project, a docker-compose.env.yaml file that is located next to the other docker-compose related files from the DDEV configuration, with the content:
version: '3.6'
services:
 web:
   environment:
     - PHP_IDE_CONFIG=serverName=your.project.name.ddev.site
This file will be merged with the other files when you restarting the project container network (ddev start / ddev stop) and the variable will be loaded more persistently and automatically.
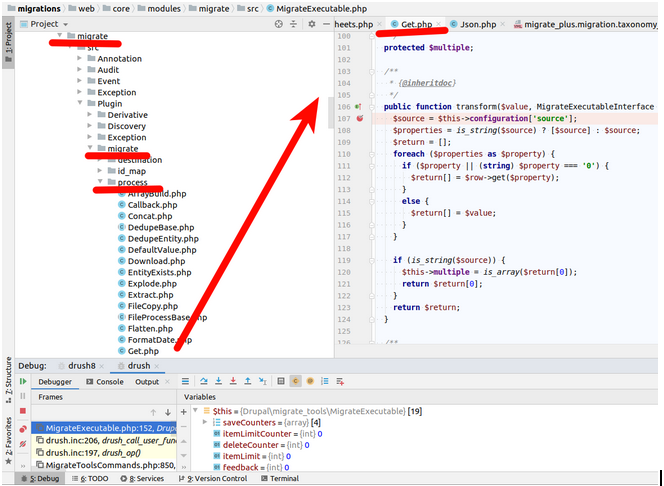
5- Breakpoints
We can then try to place various breakpoints along the code involved in a migration. For example, for processing that does not require transformation treatment (only the transfer from a source to a destination), we already know that a Process Plugin provided by default by the Migrate API is used: the Get.php class, present in /core/modules/migrate/src/Plugin/migrate/process/Get.php and in this case we can insert some breakpoints in what will be a safe place for certain migration examples: for example in the transform() method of the class (line 106):
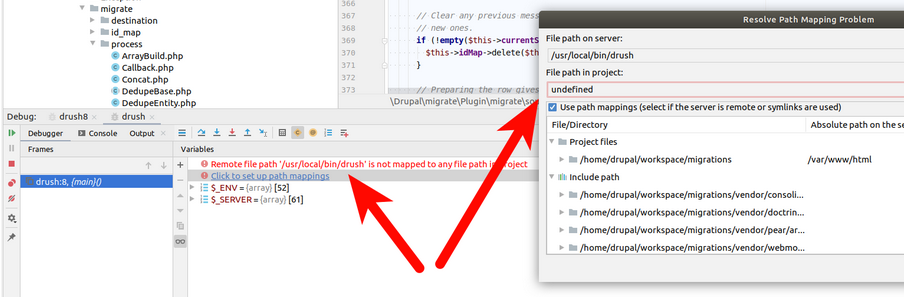
4- Errors launching Drush in containers
When we have the IDE in active listening for debugging, some breakpoints strategically located and we launch some Drush command in the context of DDEV, it is possible that when executing Drush commands, from the IDE we receive an error about the mapping of files associated to Drush. Without meaning to, it is executed on the global Drush launcher of the container, installed in the path /usr/local/bin/drush (of the operating system of the web container).
In that case, we have two options:
Ỳou can run drush directly on the /vendor address of the project (which is mapped in the previous configuration of our remote server), using the forms:
- From outside the container:
ddev exec /vendor/bin/drush migrate-status - From inside the container (ddev ssh):
/vendor/bin/drush migrate-status
Another option is recommended by Randy Fay, @randyfay (one of the creators of DDEV) in the commentary to this Github issue:
github.com/ddev/issues/2341#issuecomment-650618158.
That is, take advantage of the Drush command example as usually described in the drush.example file in the path /your-name-project/.ddev/commands/web/ and modify the Drush use case it contains by directly placing the previous path to the project vendor, going from :drush $@ to: /var/www/html/vendor/bin/drush $@
This will allow us to run debugging with Xdebug for our migrations in DDEV environments. Here you can find more information about it:
Now you can run your migration with all the safety and comfort! You can now launch your migration-related Drush commands and get the expected feedback from your breakpoints…start debugging your migration.